Brain Forecast: 15 Analytics Sources, One Verdict, Ten Seconds
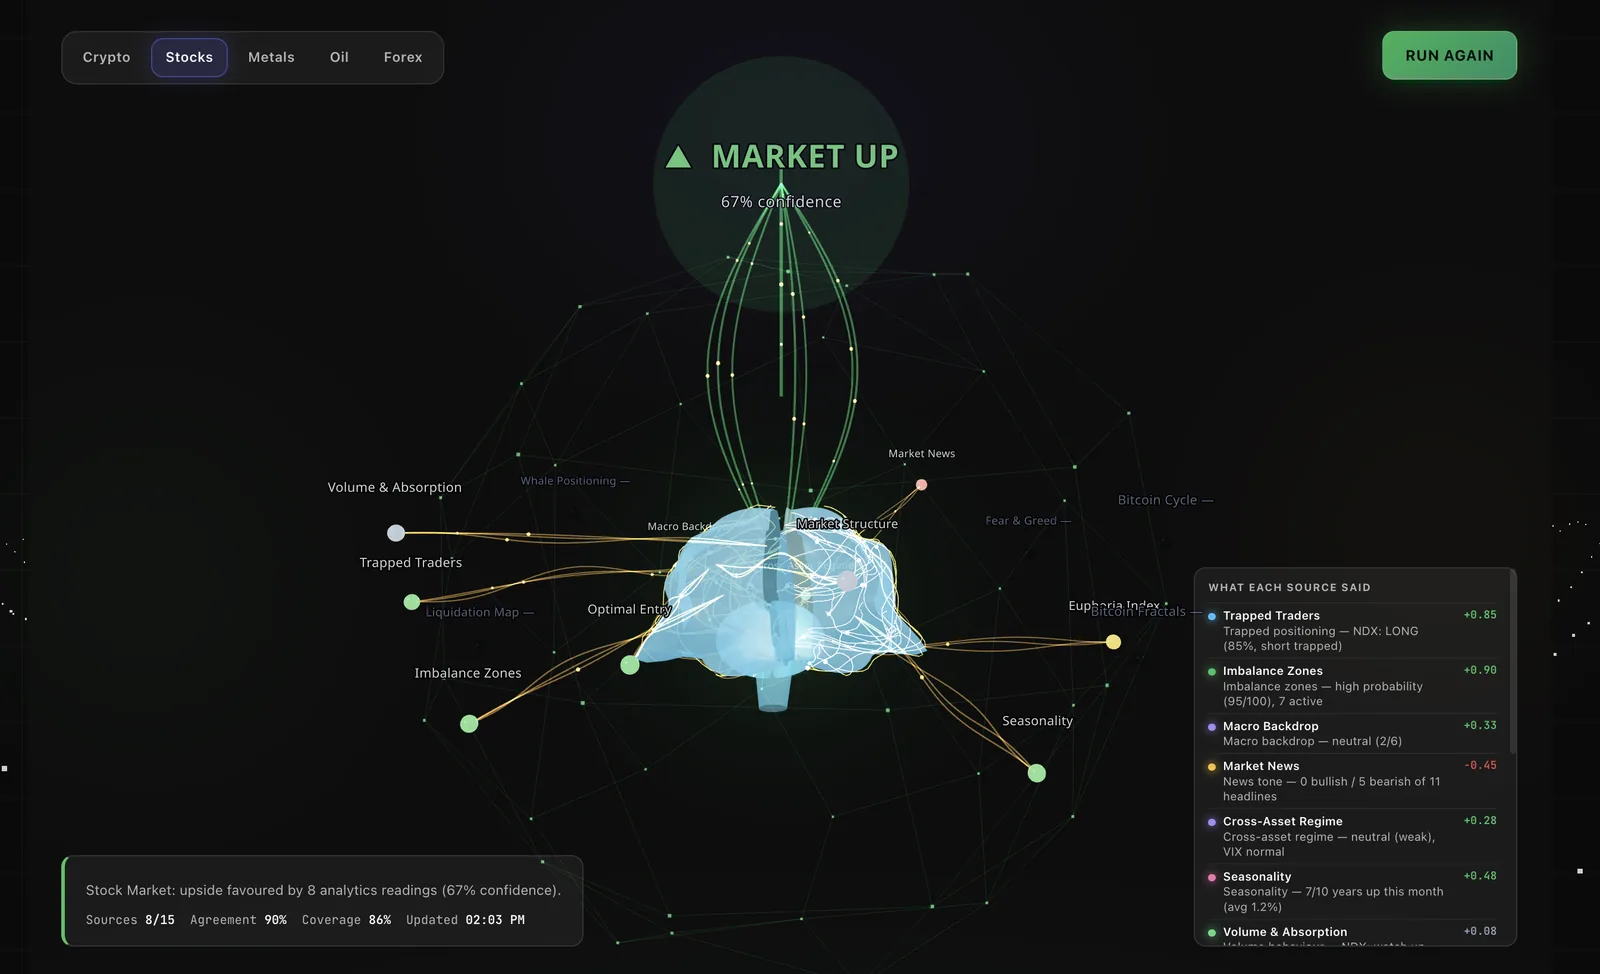
A trader's problem today isn't a shortage of data — it's the flood of it. Market structure, volume, liquidations, whale positioning, the macro backdrop, fear and greed, seasonality, cycles: it all exists, it's all available, and it all takes an hour before the session opens. By the time you've assembled the picture, half the readings are stale, the other half contradict each other, and the decision gets made on gut feel anyway.
Brain Forecast exists to solve exactly that. It reads 15 primary analytics sources at once, weights them by how much each kind of evidence is worth, and returns one verdict per market — up, down, or no clear edge — alongside its confidence, how much the sources agreed, and how much of the data actually reported. An hour of prep collapses into ten seconds of looking at a screen.
What it actually reads
The fifteen sources are grouped by role — by the kind of evidence they provide. Price action and participation outweigh opinion: sentiment and seasonality act as tiebreakers, never as a thesis on their own.
- Structure (39) — market structure (20), optimal entry (10), imbalance zones (9)
- Flow (16) — volume & absorption
- Positioning (27) — trapped traders (13), liquidation map (7), whale positioning (7)
- Macro (18) — macro backdrop (10), cross-asset regime (8)
- Sentiment (13) — market news (5), fear & greed (4), euphoria index (4)
- Cycles (14) — bitcoin cycle (6), fractals (5), seasonality (3)
The numbers in brackets are each source's share of the weight budget. This is deliberately not a one-source-one-vote headcount: on a simple tally, three weak sentiment inputs would outvote the price action itself, and they shouldn't.
Five markets, not just crypto
The switch at the top covers Crypto (BTC, ETH), Stocks (SPX, ES, NASDAQ), Metals (gold and silver), Oil (Brent) and Forex (EURUSD, GBPUSD, USDJPY). The engine knows what each market can and can't offer: whales, liquidations and fear & greed exist only in crypto; the euphoria index is equity-derived; spot FX has no honest volume, so the participation check there is simply marked unavailable rather than faked. For metals and EUR/USD the macro backdrop is inverted — they trade against dollar strength, not with it.
Honesty beats a pretty number
The three figures under the verdict aren't decoration — they're the most valuable thing on screen:
- Sources (e.g. 8/15) — how many sources actually answered this run. A silent source is dropped and the weights are renormalised over what did report. Missing is not the same as neutral.
- Agreement — how much of the reporting weight sits on the winning side. Sources near zero don't count as dissent; they're undecided, not opposed.
- Coverage — the share of the available data budget that reported. Below 50%, the engine appends its own warning to the summary: coverage is thin this run.
Confidence is built from signal strength (up to 55 points), agreement (up to 25) and coverage (up to 20), and it is hard-capped at 95%. This is a probabilistic read, never a certainty, and the interface doesn't pretend otherwise.
"No clear edge" is a result too
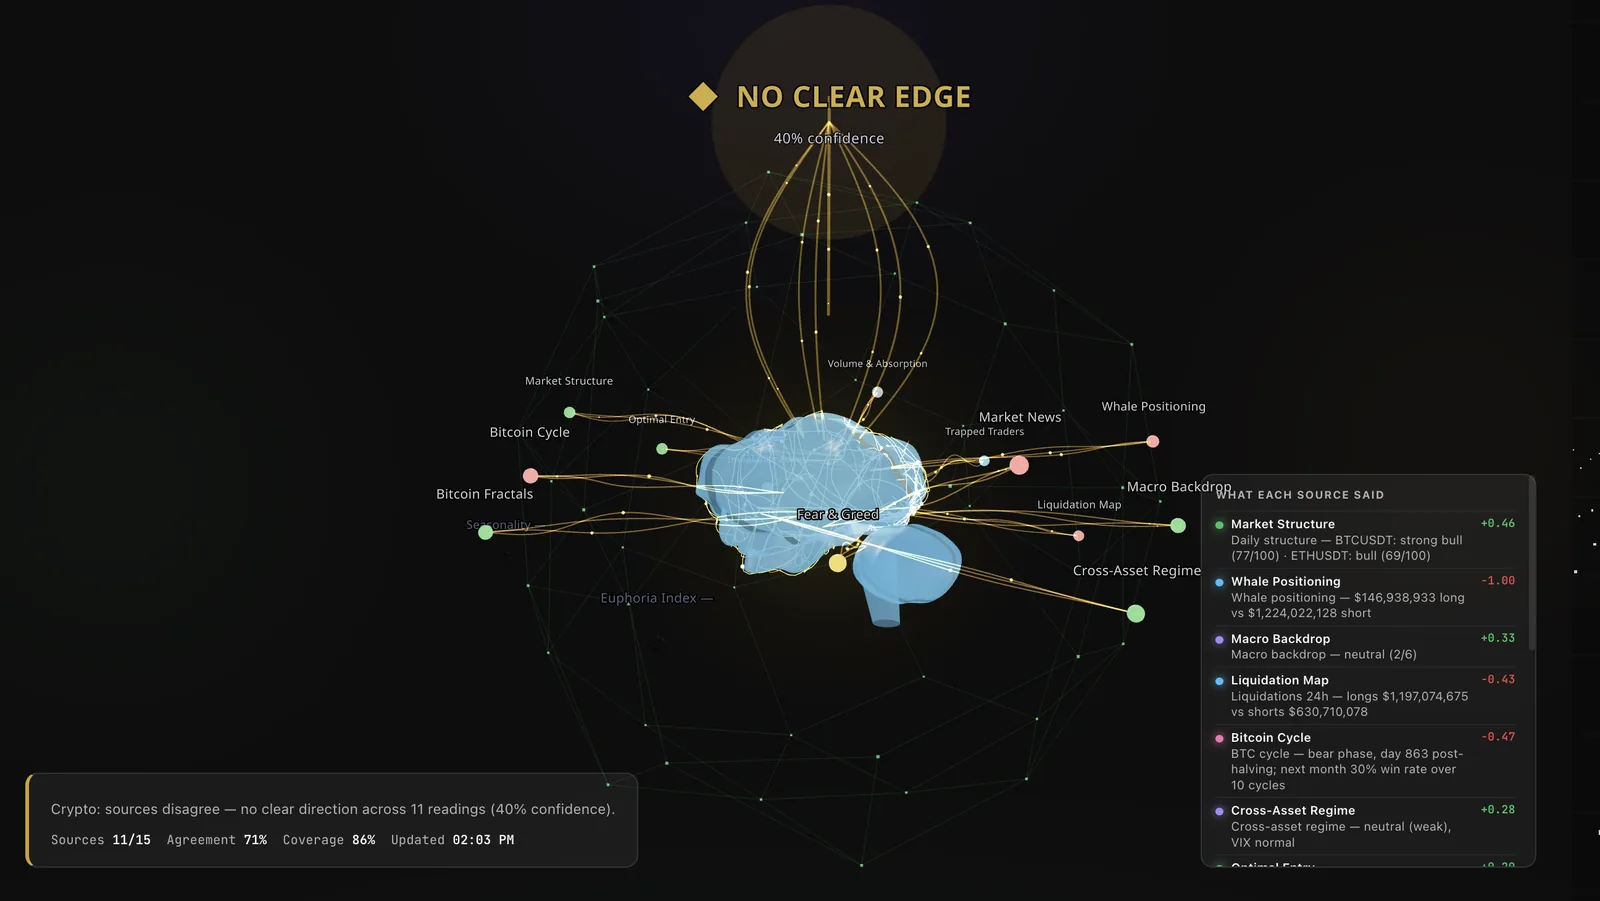
The neutral band is deliberately wide: a direction is only called at a weighted score of +0.15 or above (up) or −0.15 or below (down). A 0.06 tilt is noise, not a signal — and most indicators on the market would happily print an arrow for it. The screenshot above is exactly that case: market structure reads +0.46, but whales read −1.00 ($146M long against $1.22B short), the bitcoin cycle −0.47, the liquidation map −0.43. Agreement 71%, confidence 40% — and an honest NO CLEAR EDGE.
For a trader that's the most useful sentence on the screen: the day you didn't trade into contradictory data saves more money than a good entry makes.
The "what each source said" panel
A verdict with no breakdown is a black box, and there's no reason to trust one. So the panel on the right always lists every reading with its score from −1.00 to +1.00 and a plain line next to it: "Daily structure — BTCUSDT: strong bull (77/100)", "News tone — 0 bullish / 5 bearish of 11 headlines", "Seasonality — 7/10 years up this month (avg 1.2%)". You see not just what the engine decided but why — and precisely which reading you disagree with, if you do.
No AI in the verdict
There is no language model anywhere in this path, and that's a deliberate choice. The same inputs must always produce the same verdict, and the page must never depend on an external quota or a model's mood. Everything is a deterministic formula you can check.
Separately: Brain Forecast is never fed other aggregators — not the market forecast, not the trading bots. An aggregator inside an aggregator counts the same candles twice and manufactures agreement that isn't there. Primary sources only.
On desktop and on your phone
The scene is built with Three.js and renders right in the browser — the brain in the centre, source nodes around it, glowing links running up to the verdict. Green nodes pull up, red ones pull down, and node size reflects weight. It looks good, frankly — but the point is that the picture reads in a second: you see the tilt, you see the spread, and you see exactly who is arguing.
It behaves the same on desktop and on a phone: the scene measures itself against your viewport, and the 3D module loads separately so it never blocks first paint. Open it on your phone on the train and you know the state of the market in ten seconds without opening fifteen tabs.
How to actually use it
- Morning check. Cycle through all five markets in a minute — you'll see where there's an edge at all and where today is a no-trade day.
- A filter, not a signal. The verdict sets the side of the day; take the entry level from the dedicated indicators.
- Watch agreement, not just confidence. 60% at 90% agreement is sturdier than 70% at 55% agreement.
- Low coverage means smaller size. If half the sources stayed quiet, you don't have a full picture.
- Argue with the panel. The one reading that contradicts your thesis is exactly where the thinking is worth doing.
Brain Forecast is part of the Neuro Ultra plan, alongside the rest of the platform's advanced analytics.
Conclusion
Brain Forecast doesn't replace analysis — it removes the drudgery from it. Fifteen sources read in parallel, weighted by the role their evidence plays, honest about what didn't report, folded into one verdict with every reading spelled out beside it. An hour of preparation becomes ten seconds — on whatever device you happen to be holding.
The whole market on one screen
Fifteen analytics sources weighted into one verdict across five markets. Included with Neuro Ultra — on desktop and on your phone.