The PVLD Indicator: Price · Volume · Liquidations · Delta in One Signal
Most indicators watch one thing — price. Moving averages, RSI, MACD: all of them are derived from price, which is exactly why they always lag. But price is only the result. Behind every move sit four forces that actually create it: volume, liquidations, delta and open interest. The PVLD indicator fuses them into a single reading that answers the question that matters: is there real force behind this move — or is it a trap?
What Is PVLD
PVLD stands for Price · Volume · Liquidations · Delta. It is not another oscillator but a composite 0–100 score that compresses order-flow data into one number:
- 0–40 — Bearish. Seller pressure dominates; the move down is backed by flow.
- 40–60 — Neutral. Forces are balanced, no clear edge — better to wait.
- 60–100 — Bullish. Buyers control the flow; the move up has a real foundation.
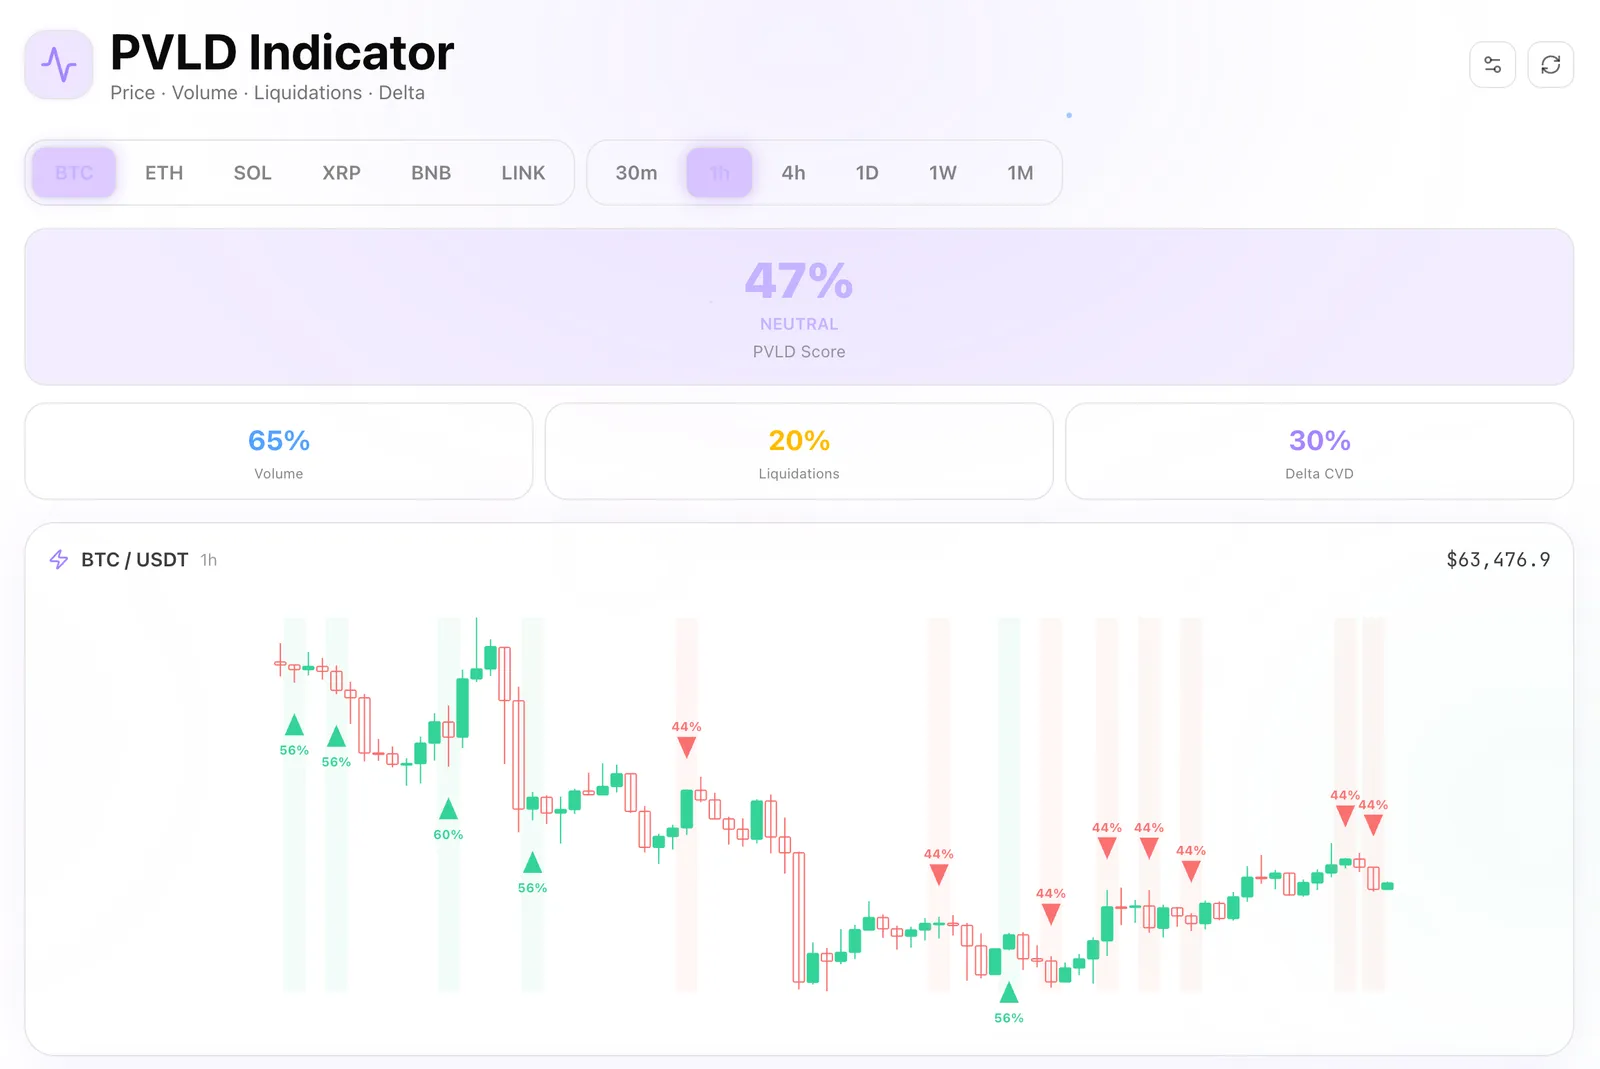
In the screenshot above the PVLD Score reads 47% (NEUTRAL), with the component breakdown visible: Volume 65%, Liquidations 20%, Delta CVD 30%. The green and red arrows on the chart mark the exact moments the score crossed the bullish or bearish threshold.
The Four Forces Inside the Score

- Price · Volume. A move on heavy volume is conviction. A move on thin volume is suspect — possible manipulation. Volume shows how many participants actually stand behind a candle.
- Liquidations. A cascade of liquidations means forced exits. Longs get liquidated on flushes, shorts on squeezes. A liquidation spike often marks a local extreme, not continuation.
- Delta (CVD). Cumulative volume delta shows who is more aggressive — buyers or sellers (by market orders). When price rises but delta falls, that is a divergence and a warning.
- Open Interest. Is OI rising with the move (fresh money entering) or falling (positions closing)? Price up without OI up is a weak move.
Why One Score Beats Four Charts
You could open four separate indicators and try to read them at once. But in real time that overloads your attention — and decisions get made on emotion. The strength of PVLD is synthesis: it weighs all four flows and outputs one number and one arrow. You don't read “volume is up but delta is down and liquidations…” — you simply see: there is a signal, or there isn't.
How to Trade PVLD
- Pick an asset and timeframe. PVLD covers BTC, ETH, SOL, XRP, BNB and LINK across timeframes from 30m to 1M. The higher timeframe sets context, the lower one times the entry.
- Wait for a threshold break. Don't trade the neutral zone (40–60). The signal is the score crossing into bullish (>60) or bearish (<40) territory, marked by an arrow on the chart.
- Check the breakdown. A strong signal is when components agree: price up + high volume + positive delta. If volume is high but delta runs against the move, be cautious.
- Combine with liquidity. A PVLD signal landing on a liquidity zone or an FVG is a maximum-quality setup.
The PVLD Indicator on NeuroTrader
On the NeuroTrader platform the PVLD indicator is computed from real exchange data and updates in real time. You get:
- A single PVLD Score labeled Bullish / Neutral / Bearish
- A breakdown of Volume, Liquidations and Delta CVD — see exactly what is moving the market
- Bullish and bearish arrows directly on the candle chart with the signal strength in %
- 6 assets (BTC, ETH, SOL, XRP, BNB, LINK) and timeframes from 30m to 1M
Conclusion
Price lies. Volume, liquidations and delta do not. PVLD doesn't try to predict the future from past price — it shows the real balance of forces right now. One score instead of four charts. One arrow instead of guesswork. See the flow, and enter where the money goes — not where emotion calls you.
PVLD Score in real time across 6 assets
See volume, liquidations and delta balance in one score. Enter where the flow goes.