Technical Analysis AI: One-Click Chart Analysis Instead of TradingView
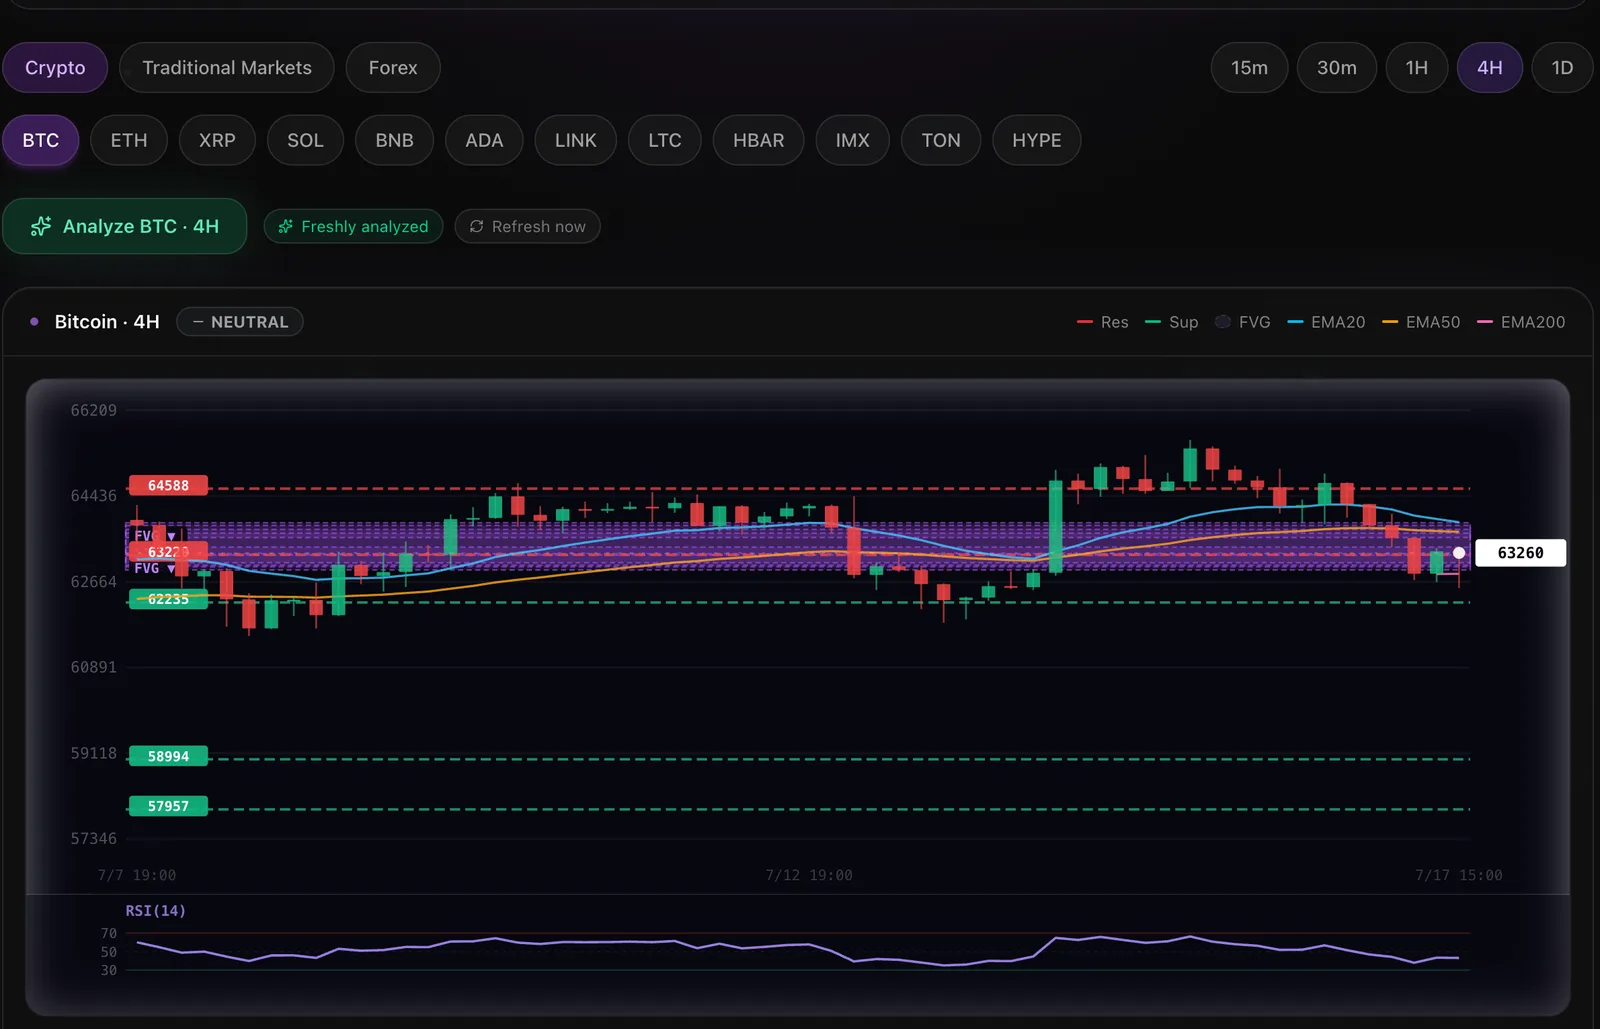
The routine before every trade is familiar: open TradingView, draw support and resistance by hand, check RSI, glance at EMAs, gauge trend strength with ADX, hunt for liquidity zones and FVGs — and only then decide whether to buy or sell. It takes time, and the result still depends on how carefully you read the chart today. You don't need any of that anymore — just use our form: pick an asset and a timeframe, hit one button — Analyze — and get the result in a few seconds.
What Technical Analysis AI Does
Technical Analysis AI isn't a pile of indicators you still have to read yourself — it's a finished chart breakdown, one click away. It computes real exchange data and builds:
- RSI(14) — overbought/oversold state
- EMA 20/50/200 — trend and its direction
- ADX(14) — trend strength (weak chop vs. a confident move)
- Resistance and support zones — clustered reversal points from swing pivots
- FVGs (Fair Value Gaps) — imbalance zones that often pull price back for a retest
In the screenshot above — BTC on the 4H timeframe: you can see the resistance zone (red dashed line), the support zone (green), two FVG zones and all three EMAs drawn directly on the candle chart, plus RSI(14) in its own panel below.
The AI Day Scenario
The real value isn't the numbers themselves — it's what the AI does with them. Based on the computed indicators, Technical Analysis AI writes a day scenario: an overall bias (bullish / bearish / neutral), a short summary of what's happening on the chart right now, a separate upside scenario, a separate downside scenario, and the level at which the scenario is invalidated.
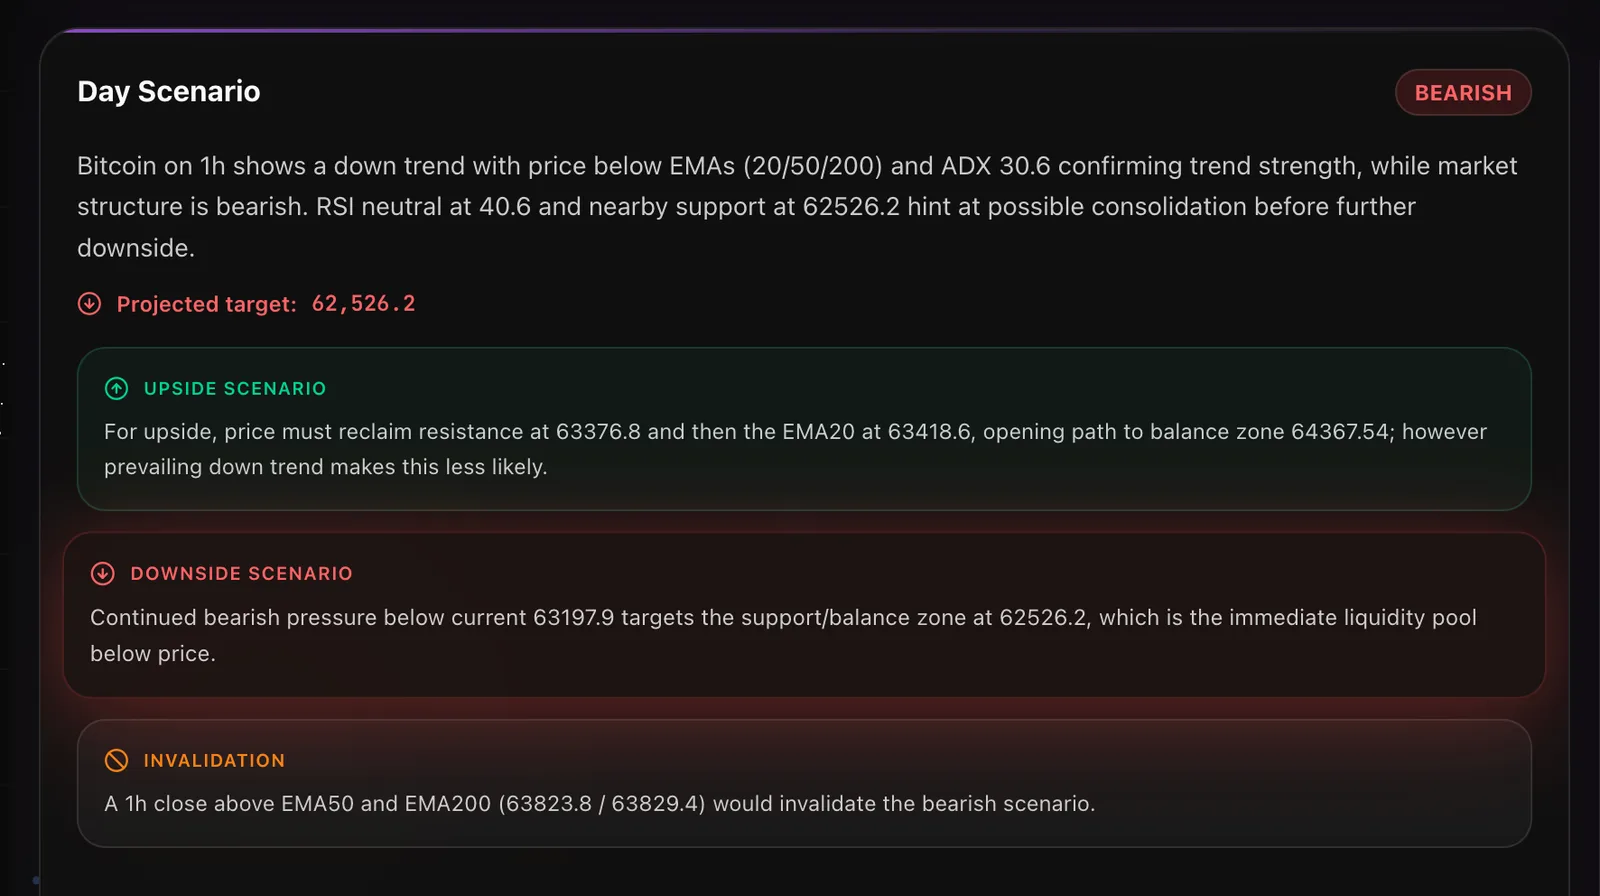
Importantly, the AI doesn't invent levels — it comments on numbers that are already computed (RSI, EMA, ADX, liquidity zones) and picks the projected target from real zones on the chart. That's the difference between "the AI is guessing" and "the AI is explaining what's already on the chart in plain language."
How to Use It
- Pick an asset class and asset. Crypto (BTC, ETH, XRP, SOL, BNB, ADA, LINK, LTC, HBAR, IMX, TON, HYPE), traditional markets (S&P 500, NASDAQ, Gold, Silver, Brent) or forex (EUR/USD, USD/JPY, GBP/USD and other majors).
- Pick a timeframe. From 15m to 1D — for scalping or for a full day's context.
- Hit Analyze. The result is ready in seconds: a fully marked-up chart plus a written day scenario.
- Check the target and the invalidation level. Those two levels are what turn a breakdown into a plan — where the target sits, and where the scenario is off the table.
Re-analyzing the same asset and timeframe within 15 minutes is served from cache (a "From cache" badge instead of "Freshly analyzed"), and the "Refresh now" button always recomputes everything.
Open a Trade Based on This
Technical Analysis AI isn't meant to replace your judgment — it's meant to remove the routine part of the analysis. Instead of spending half an hour marking up a chart by hand, you get the full picture instantly: trend, trend strength, key zones and a day scenario — and you decide whether to open a trade based on that. The markup updates in real time and is always based on live exchange data, not a stale snapshot of the market.
Conclusion
Opening TradingView, computing RSI and EMAs yourself, hunting for liquidity zones and guessing what matters — none of that is a required step before a trade anymore. Technical Analysis AI does all of it for you in one click and a few seconds, and hands back a clear day scenario with a target and an invalidation level.
Chart analysis in one click
RSI, EMA, ADX and liquidity zones plus an AI day scenario — in seconds.