Bitcoin DCA: How to Find the Best Month to Buy BTC with the Cycle Indicator
DCA (Dollar-Cost Averaging) — buying a fixed dollar amount of Bitcoin at regular intervals — is the most honest strategy a long-term investor has. It removes emotion, averages your entry, and works even when you have no idea where the bottom is. But blind DCA has one weakness: you buy the same at the bottom and at the top. Yet Bitcoin has structure — halving cycles and pronounced seasonality. If you know when to add more and when to keep dry powder, the same budget buys noticeably more coins. That is exactly what the Bitcoin Cycle indicator shows.
Why Plain DCA Leaves Money on the Table
Classic DCA says: “buy $100 every week, no matter what.” That works beautifully against human psychology — you don't panic and you don't try to time the bottom. But mathematically it ignores one thing: Bitcoin's price isn't random. It moves in four-year cycles around the halving and carries repeating monthly seasonal patterns. By buying identically in every phase, you spend the same dollars in overheated euphoria as in an accumulation phase near the 200-week average — and that's a very different amount of BTC for the same money.
The fix isn't to abandon DCA — it's to make it weighted: the base buy always happens, but the size of your “top-up” depends on where we are in the cycle and how historically strong the current month is.
What the Bitcoin Cycle Indicator Shows
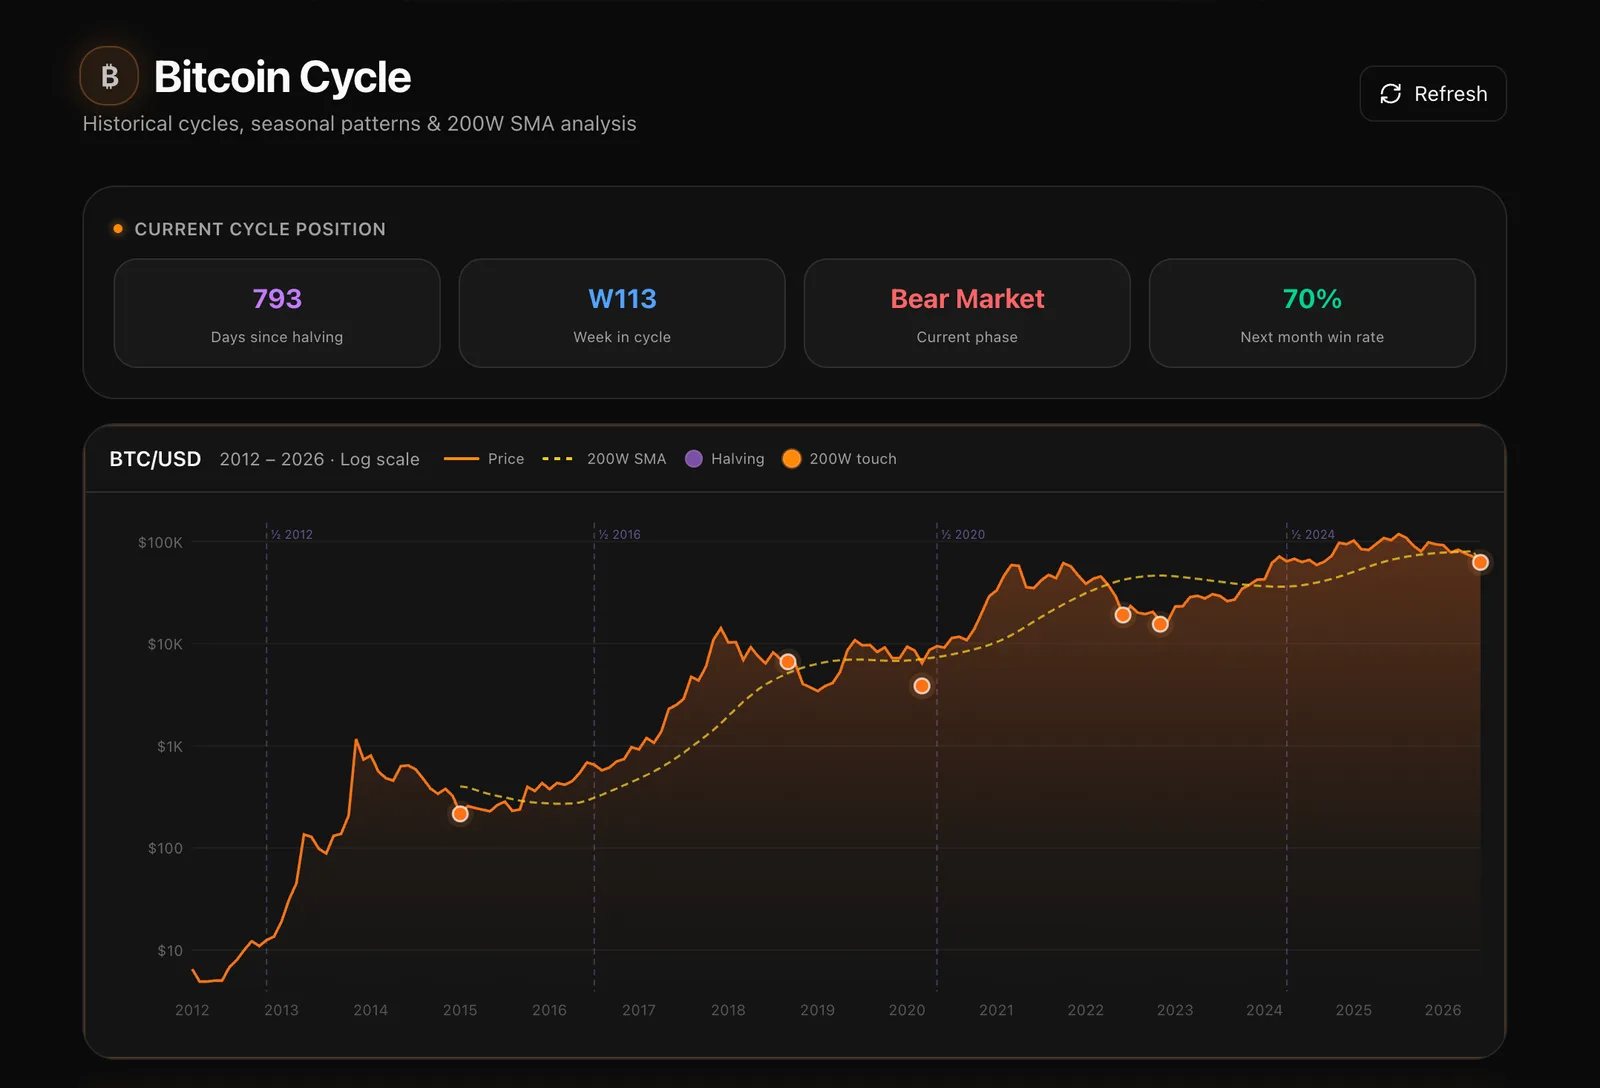
The screenshot above has three data blocks that turn DCA from a ritual into a strategy:
- Cycle phase and days since halving. 793 days since the halving, week 113, current phase Bear Market. The indicator breaks each cycle into phases: accumulation → bull → euphoria → bear → recovery. The best zones for aggressive accumulation are accumulation and the late bear phase — not euphoria at the highs.
- 200-week SMA and touches. The yellow line on the log chart is the 200W SMA, Bitcoin's historical “floor.” The orange dots mark moments when price touched that average. Almost every 200W touch in history has been one of the best entries a long-term buyer could get.
- Next-month win-rate. 70% — the share of past cycles where the next calendar month closed green. That's seasonality: the indicator measures, month by month, how often it has historically been “green.”
The Best Month to Buy: BTC Seasonality

Bitcoin has historically had “strong” and “weak” months. The autumn-to-winter stretch (especially October and November — there's a reason traders call October “Uptober”) and the start of the year showed high win-rates, while late spring and mid-summer were often sluggish. Important: seasonality is a statistical probability, not a guarantee. A single month decides nothing — but across dozens of buys, the edge toward strong months compounds.
The Bitcoin Cycle indicator takes this data across all four halving cycles (2012, 2016, 2020, 2024) and shows, for every calendar month, the average result, the bullish/bearish close count and the resulting win-rate. So you can see in advance which of the upcoming months has historically been the best to enter.
A Practical Smart-DCA Model
You can fold all of this into a simple strategy. The core principle is never skip a buy — just vary its size:
- Base every time. Each week/month, buy a fixed amount — your foundation that works in any scenario.
- ×1.5–2 in the strong zone. If the indicator shows an accumulation phase, price near the 200W SMA or a touch of the average, plus a high next-month win-rate — increase the top-up. These are statistically the best moments to let each dollar buy more BTC.
- Base only (or pause the top-up) in euphoria. When the phase is euphoria, price is far above the 200W SMA, and the month is historically weak, keep dry powder: continue the base but don't ramp buys at the highs.
The result: you don't guess the bottom and you don't panic, yet your average entry systematically drifts lower than blind DCA. Same budget — more Bitcoin.
What DCA Still Can't Skip
Bitcoin Cycle is a probability tool, not a time machine. Seasonality can break in a given cycle, macro events (ETF flows, rates, regulation) can override any pattern, and past results don't guarantee future ones. So the indicator isn't used as an “all-in signal” but as a buy-size filter on top of disciplined DCA. Discipline does the work; the cycle just helps you aim it.
The Bitcoin Cycle Indicator on NeuroTrader
On the NeuroTrader platform the indicator is computed from verified historical data across all cycles and updates in real time. You get:
- The current cycle phase and the number of days/weeks since the halving
- Distance to the 200-week SMA and markers of its historical touches
- Win-rate and average result for every calendar month (seasonality)
- A next-month win-rate forecast to plan your top-up
- A comparison of the current cycle against 2012, 2016, 2020 and 2024
Conclusion
DCA wins through discipline, not timing. But discipline can be sharpened with structure. Bitcoin moves in cycles and carries seasonality — and ignoring that means buying identically in the best and the worst moments. The Bitcoin Cycle indicator shows where we are in the cycle and which month has historically been stronger, so that across the long run each dollar buys the most Bitcoin it can. Don't guess the bottom — weight your DCA.
See the best month to buy BTC
Cycle phase, 200W SMA touches and monthly seasonal win-rate — to weight your DCA instead of guessing.