Stop Listening to Anyone. Trading Is a Numbers Game
Open YouTube and within ten minutes you will have five “experts” with five different opinions about where Bitcoin is headed. One draws lines on a chart and promises $150,000 by fall. Another is screaming about a crash. A third is selling a course on “how I made a million.” None of them shows you the order book, the volume delta, or a real-time liquidation map. What they show you is an opinion — subjective, often colored by whatever benefits them for you to do next.
Trading is not about whose voice sounds most confident. It is about numbers: volume, open interest, liquidations, buy/sell delta, the long/short ratio. Everything else is noise.
YouTube Can Teach You the Basics. It Cannot Give You Data
This does not mean educational content is useless. On YouTube and Twitter you can genuinely learn the fundamentals — what support and resistance are, how to read candles, what RSI measures. That is the base layer, and it is worth knowing.
But the base layer is not the same as live market data right now. No creator is recalculating open interest across 7 exchanges every minute. No video shows you exactly where liquidations have clustered on a specific timeframe for a specific asset at this exact second. Education and analytics are two different things, and confusing the two is how accounts get wiped out.
Why “expert opinion” is a poor basis for a trade
What “Trading Is a Numbers Game” Actually Means
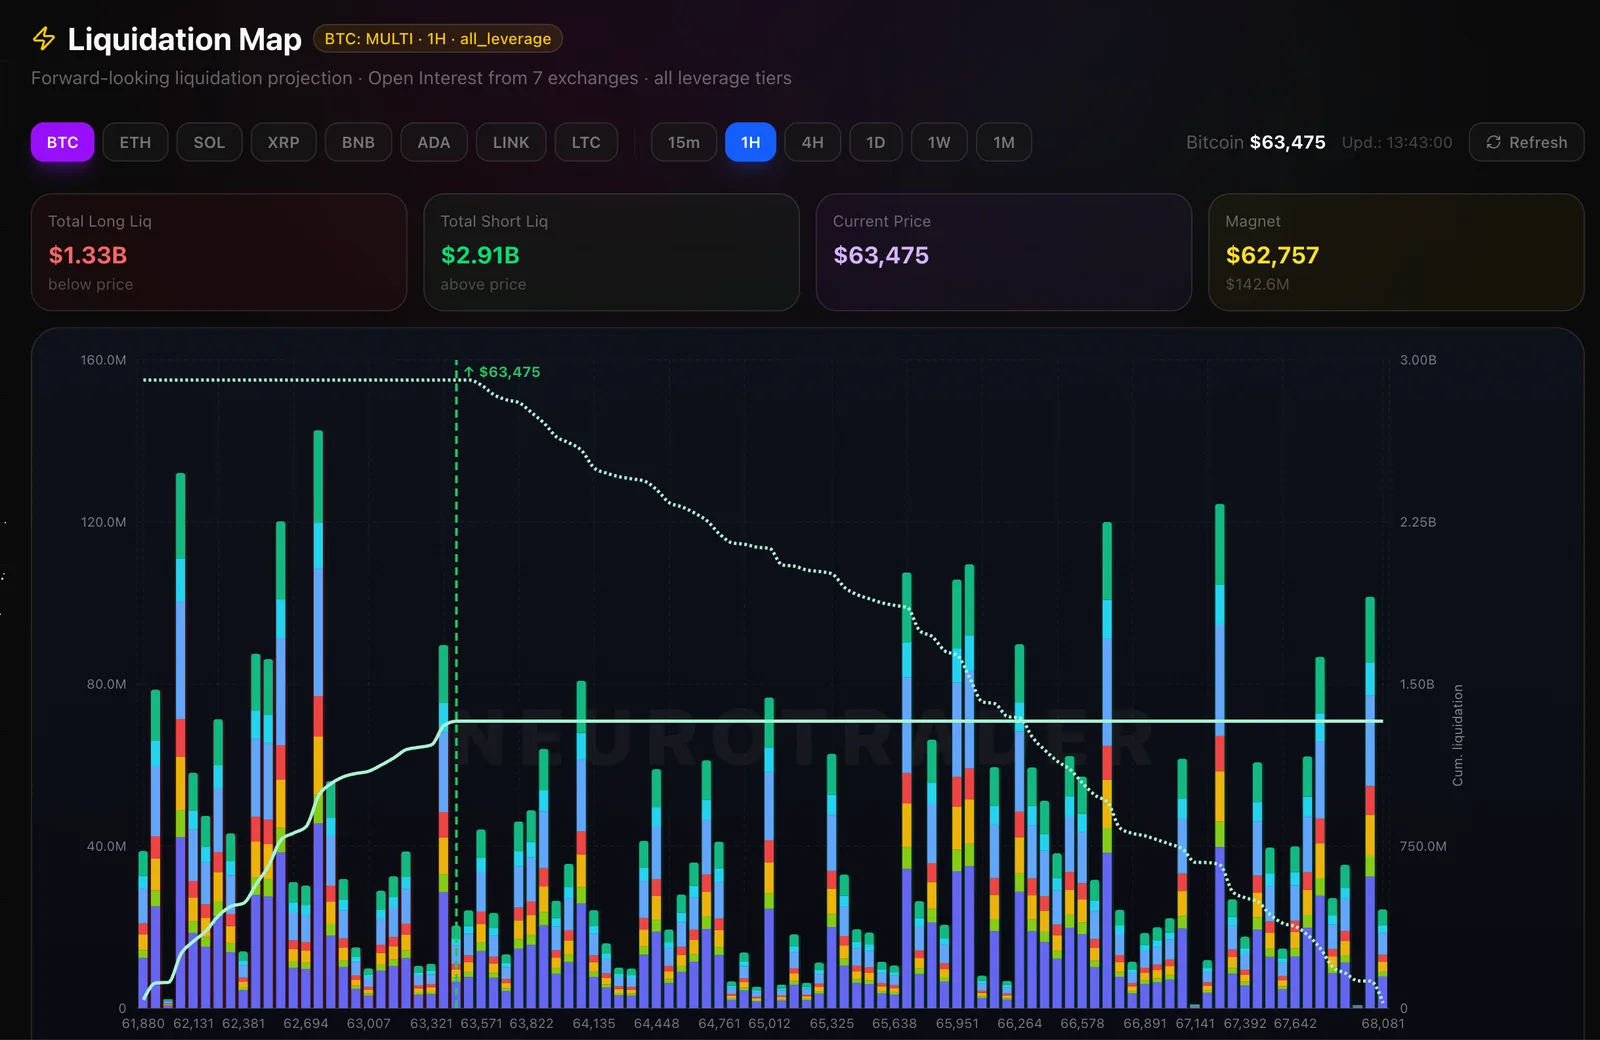
Everything on the platform runs on algorithms and real numbers, not sentiment. The liquidation map below, for example, is not an opinion — it is a fact: exactly where stop-losses and leveraged positions have piled up across the price range, based on open interest data from 7 exchanges. This is not guesswork — it is market mechanics you can measure.
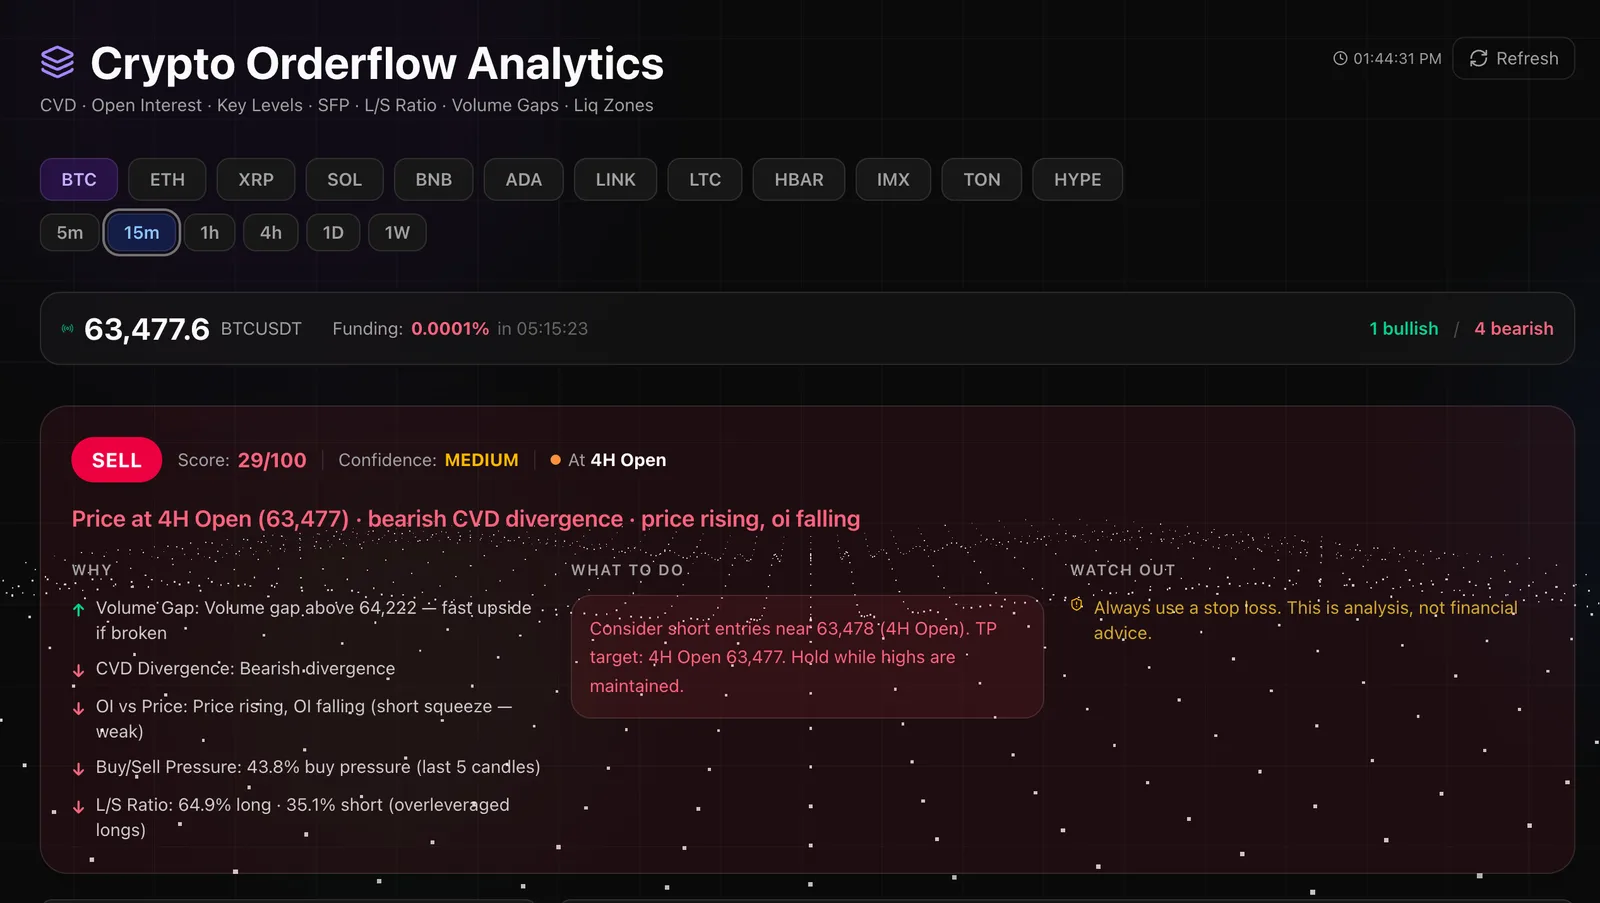
Same with order flow analytics: the SELL or BUY signal in the screenshot below is not a “feeling” — it is a sum of specific weighted factors: CVD divergence, the open interest-to-price ratio, buy volume versus sell volume over recent candles, the long/short skew. Every line in the “Why” panel is a measurable number, not a guess.
Without Risk Management, Data Is Useless
Even with the best analytics in the world, there is exactly one way to blow up an account: trading without controlling risk. Good data will tell you a probable entry point. But if you risk 20% of your account on a single trade, sooner or later a losing streak — and it happens to everyone, even with a precise algorithm — will wipe you out.
The formula is simple and unavoidable: if your average loss is bigger than your average win, you will not make money even if you guess direction correctly 6 times out of 10. This is exactly why the platform has a Calculator for position sizing and a Journal for logging every trade — not as a formality, but so you can see your actual statistics: win rate, average profit versus average loss, drawdown.
How to Actually Use the Platform
- Watch the analytics, not the forecasts. Liquidations, order flow, open interest, L/S ratio — numbers that have already happened or are happening right now, not someone's prediction.
- Log every trade in the Journal. Without a record you will not know whether your strategy is working or you simply got lucky on your last five entries.
- Size risk in advance with the Calculator. Position size should be derived from your stop and your capital — not from “how confident you feel.”
- Use what you learned on YouTube as a filter, not a signal. Basic market-structure knowledge is useful for understanding WHY the algorithm is showing a given signal — not for arguing with the numbers.
Conclusion
No one knows the future — not the creator with a million subscribers, not the TV analyst, not your friend who “called the bottom” once. What you can know is what the market is doing right now: where volume is flowing, where liquidity has clustered, who is overleveraged. That is analytics built on algorithms and numbers — no emotion, no opinions. Add disciplined risk management, and that is the entire formula that actually works.
Analytics built on numbers, not opinions
Order flow, liquidations, open interest — plus a Journal and Calculator so your risk management is as precise as the analytics.