A Day of a Trader: From the Morning Chart to a Journaled Trade
A good trading day starts long before the first trade. Not with opening a terminal, not with chasing a candle that already ran — but with a routine that looks nearly identical across most consistent traders: context first, then a signal, then discipline in execution. Here's what that day actually looks like, step by step, with real screenshots from the platform.
Morning: the Chart, Not the Terminal
Wake up, wash up, a quick workout, breakfast — only then does the laptop open. The first thing isn't a trade, it's the chart. There's already a rough read on the market, so the eye moves top-down: daily timeframe first to gauge the overall trend, then 4-hour to see the structure inside that trend, and only then 1-hour to hunt for a specific entry — if there even is one today. If there isn't, that's a valid outcome too. Not every day requires being in the market.
Step 1. News Sentiment
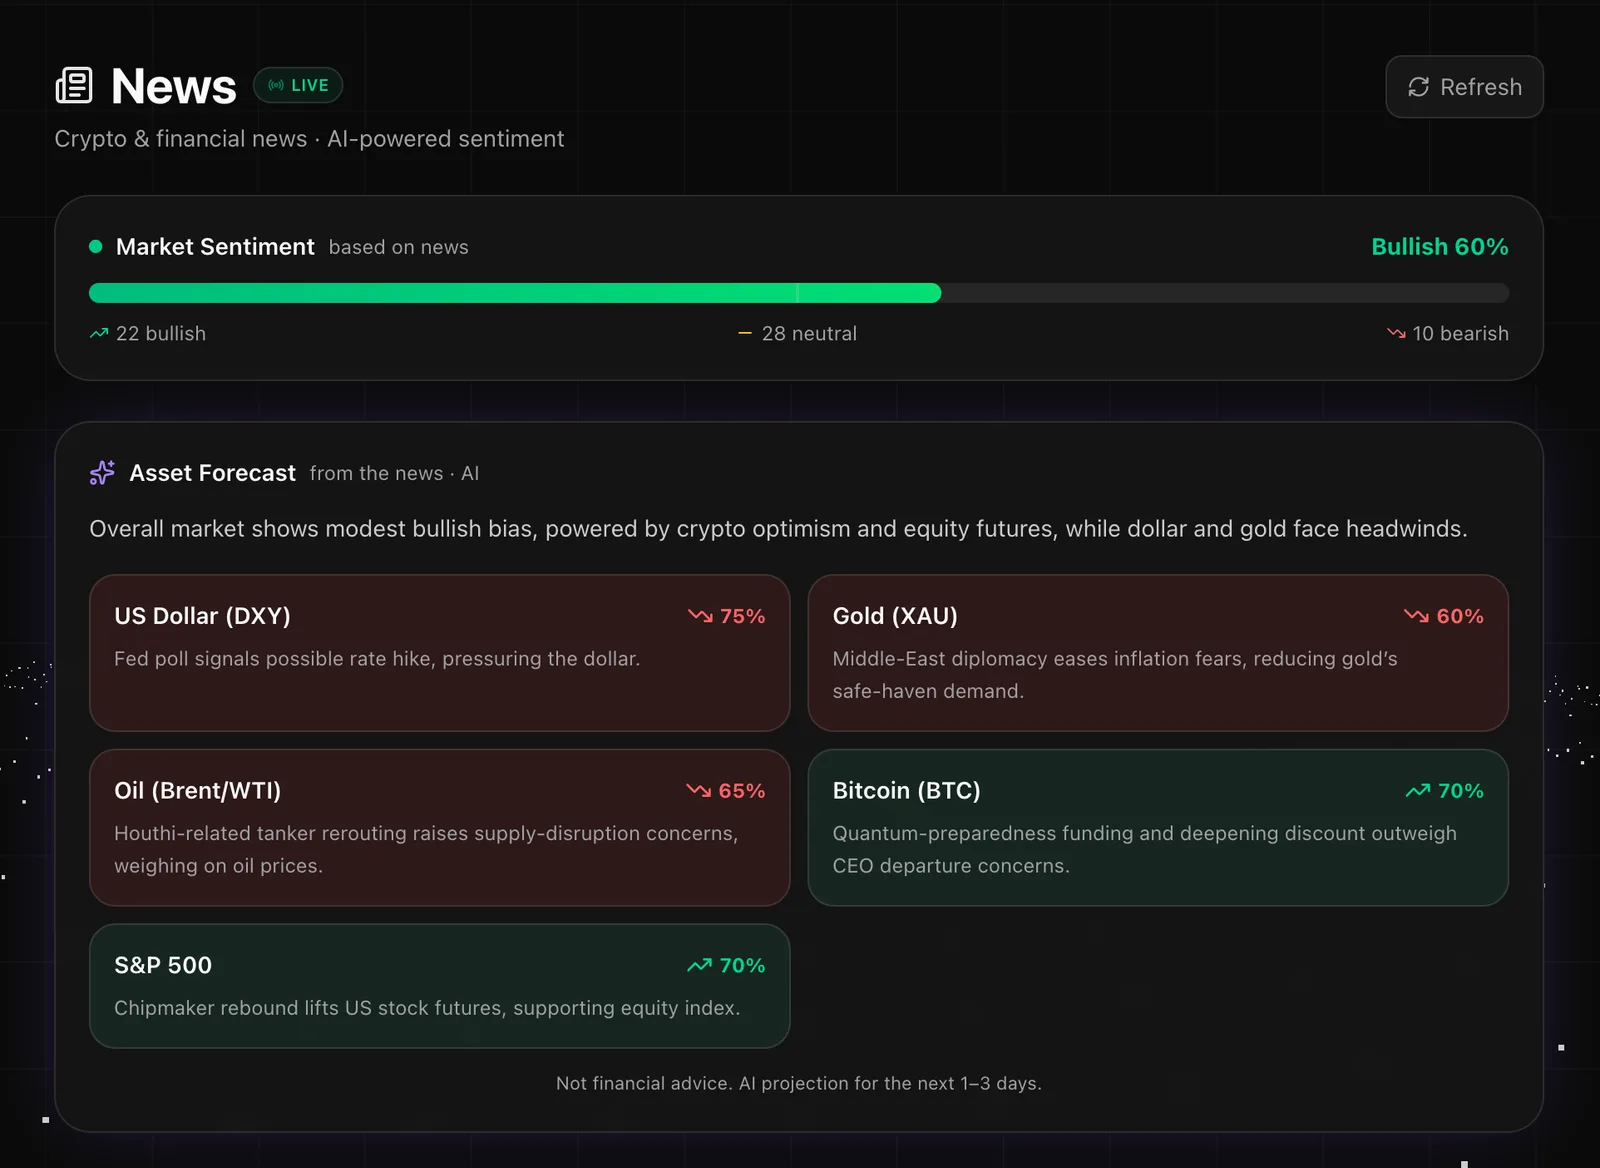
Next is the News tab on NeuroTrader. An AI algorithm here reads which type of news is currently dominant — bullish or bearish — and which way sentiment leans for specific assets: the dollar, Bitcoin, gold, oil.
In the screenshot, overall Market Sentiment sits at 60% Bullish (22 bullish headlines, 28 neutral, 10 bearish), and below it the Asset Forecast breaks it down per asset: the dollar (DXY) leans 75% down on a possible Fed rate hike, gold leans 60% down on fading safe-haven demand, oil leans 65% down on supply concerns, while Bitcoin and the S&P 500 both lean 70% up. This isn't a trade signal by itself — it's the backdrop the technical analysis either confirms or gets weighed against.
How to use it
If a technical setup on the chart lines up with the news backdrop, conviction goes up. If it contradicts it, that's not a reason to cancel the trade — it's a reason to size it more carefully.
Step 2. Seasonality and Cycles — Should You Even Trade This Month
After the news, it's Market Seasonality and Bitcoin Cycle. The job here is simple: figure out what calendar month it is and how the market has historically behaved during that exact period over recent years. Sometimes the honest conclusion is "sit on your hands, don't trade."
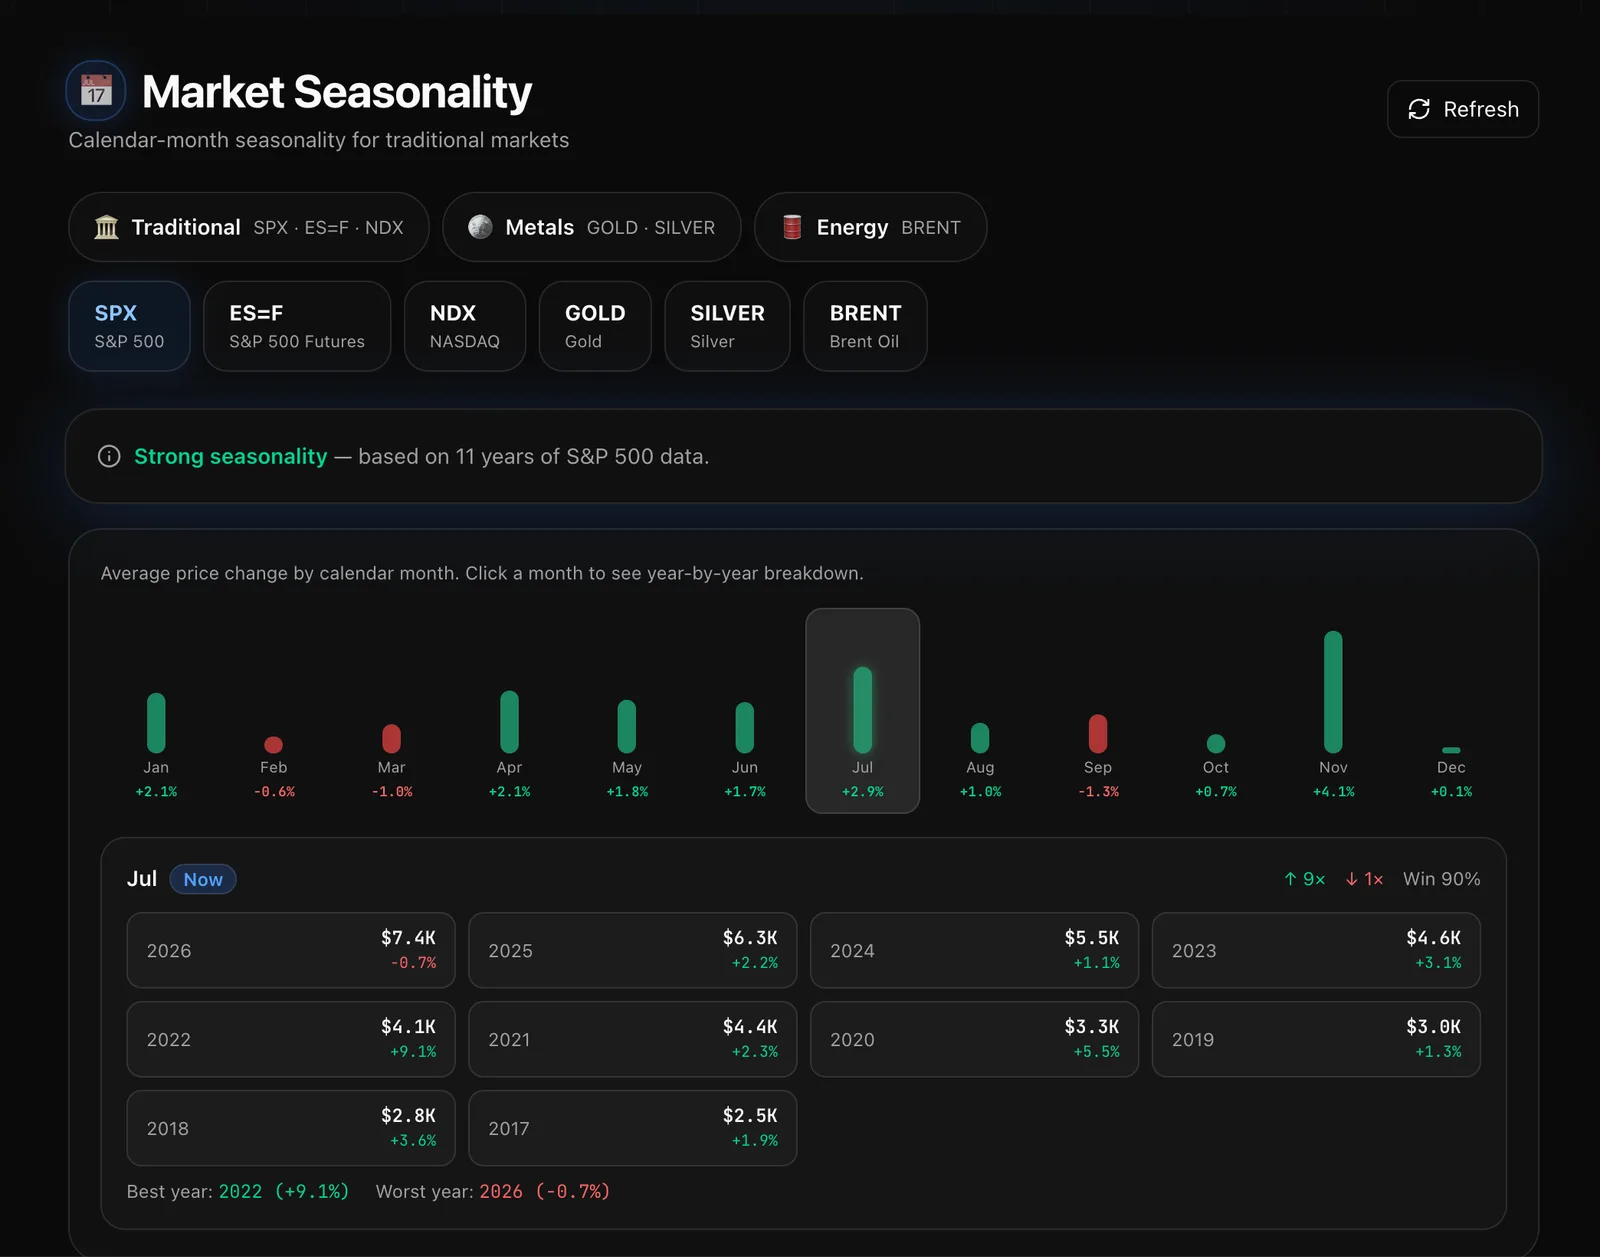
In the screenshot: S&P 500 seasonality over 11 years, where July averages +2.9%, closed green 9 of the last 10 years, a 90% win rate. November stands out as the strongest month on the chart (+4.1%), while September is historically negative (-1.3%) — a classically weak month for the market. If it's September, the sensible move is to scale back activity rather than force trades. If it's October or November, seasonality is on the trader's side and entries are worth hunting more actively.
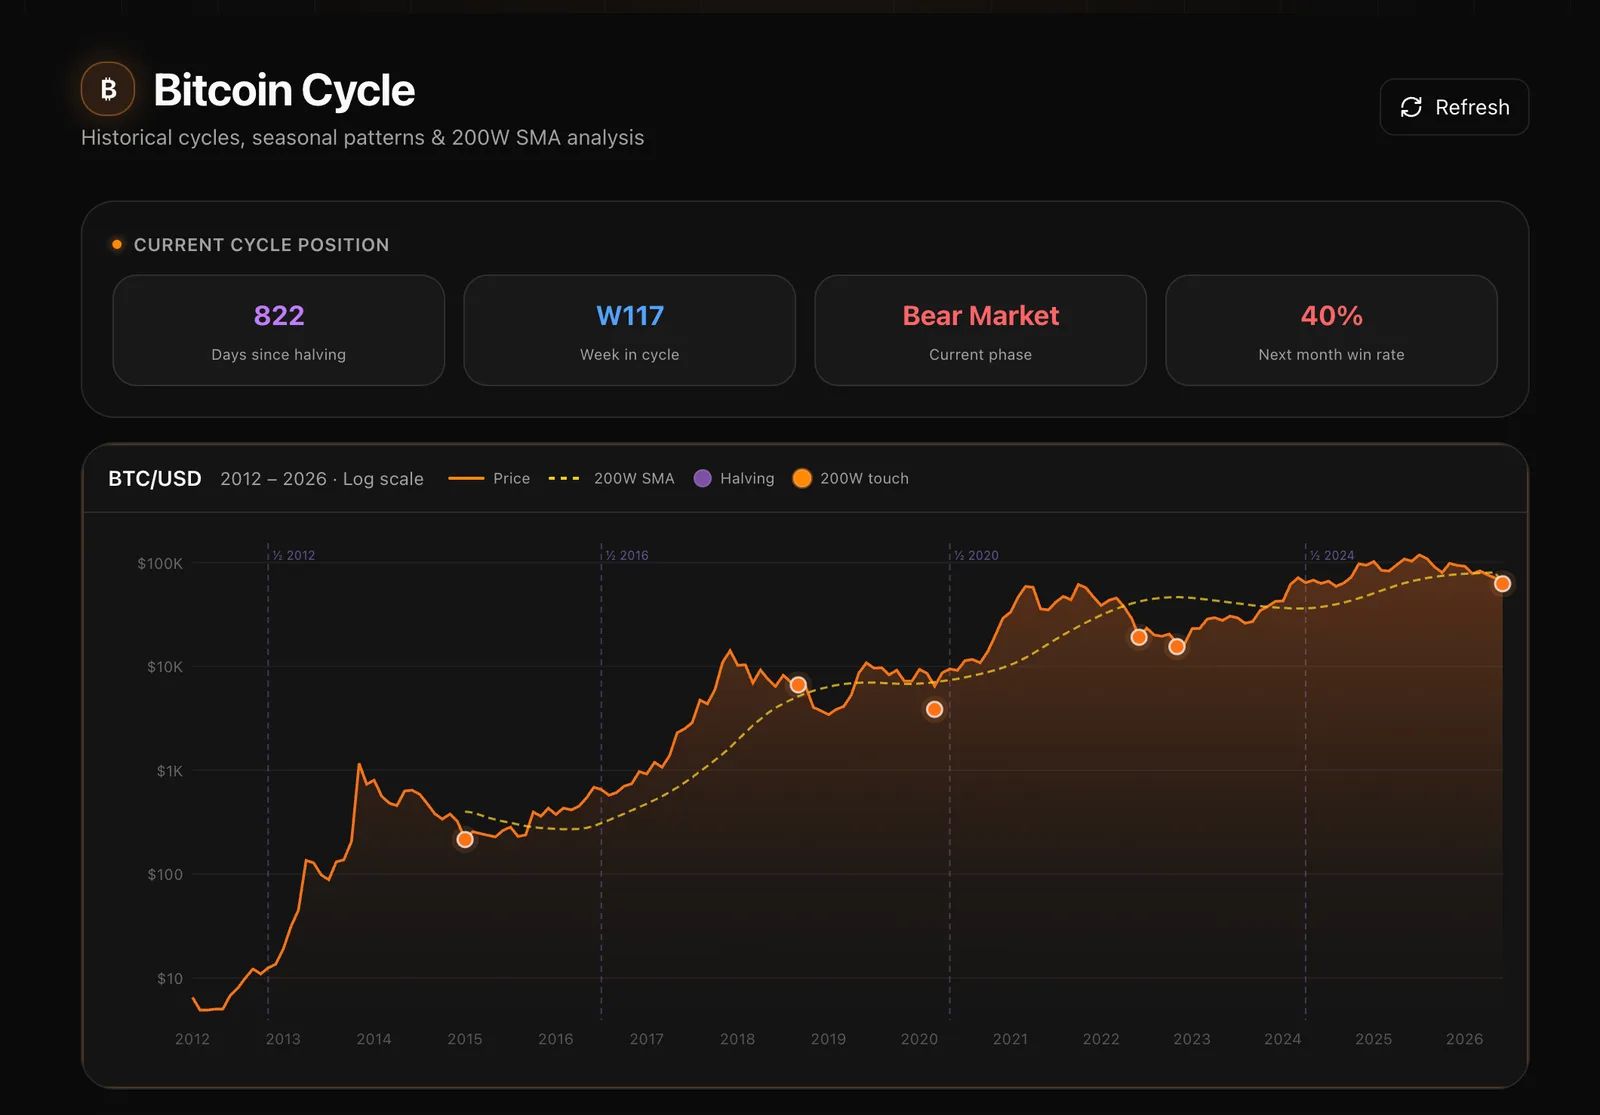
For crypto, the same idea plays out through the halving cycle instead: Bitcoin Cycle shows how many days have passed since the last halving, which week of the cycle it is, the current phase (Bear Market in this example), and the historical odds of a win next month. It's slow, macro context — it doesn't hand you an entry, but it tells you whether hunting for longs even makes sense right now, or whether trimming risk is the smarter call.
Step 3. Crypto Confirmation — Trading Bot V2
If crypto is on the table, the next stop is Trading Bot V2. This isn't automated trading — NeuroTrader deliberately doesn't let a robot blow the account by deciding entries on its own. Bots tend to go off the rails: one bad streak, no emotional brake, and the deposit is gone. Instead, the bot delivers analytics: it strips emotion out of the equation and flags whether the current market structure actually lines up with a good entry.
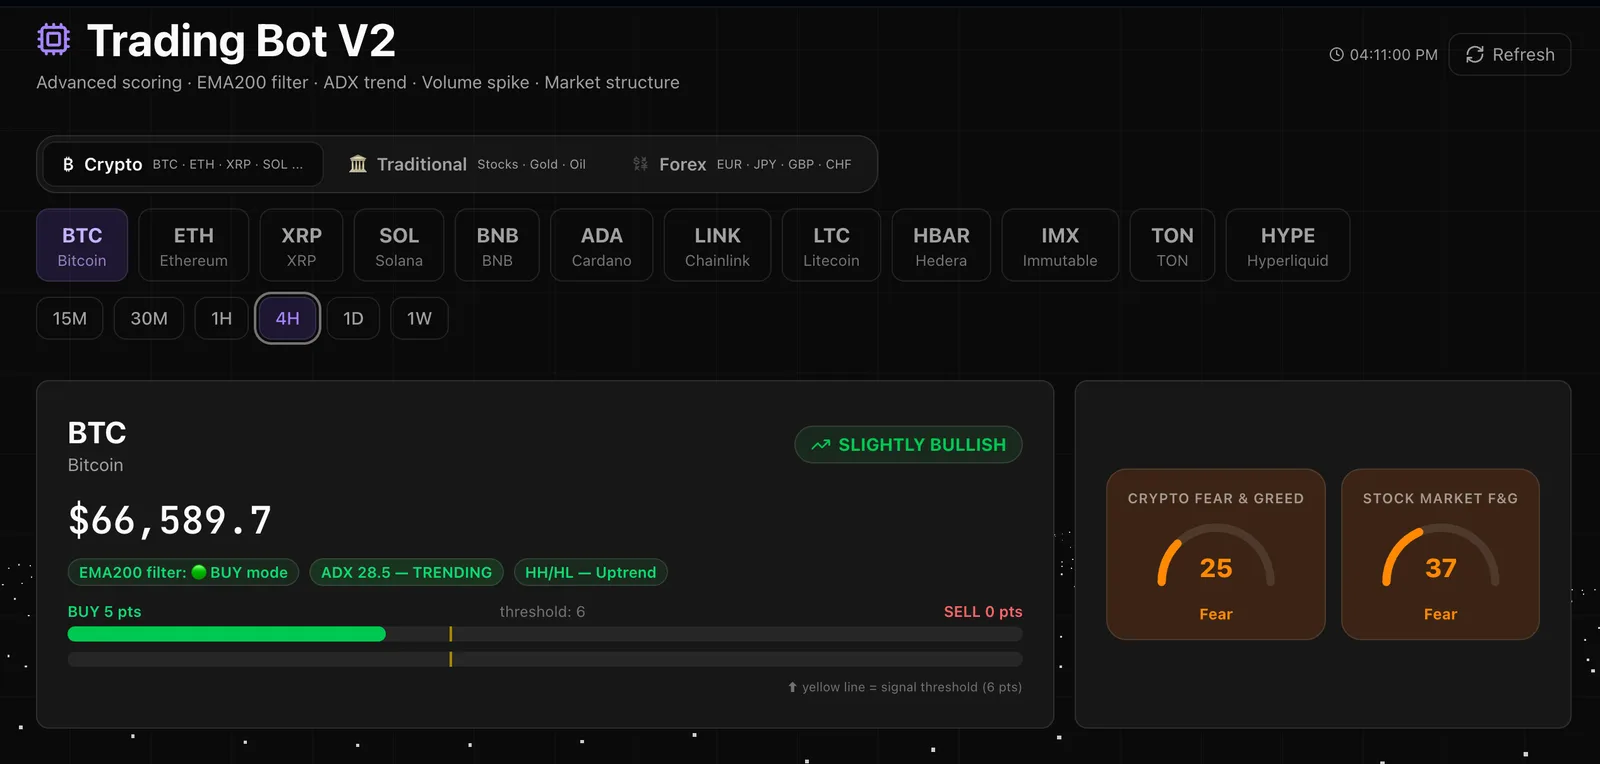
In the screenshot, BTC on the 4-hour timeframe reads "Slightly Bullish": price above EMA200 (BUY mode), ADX at 28.5 confirming the trend is actually moving, HH/HL structure pointing up. The score bar shows 5 points against a signal threshold of 6 — direction is already clear, but the full signal hasn't fired yet, meaning the entry should be sized carefully rather than pushed with full size. On the right, separate Fear & Greed gauges for crypto and stocks give the broader psychological backdrop.
Step 4. Back to the Chart, a Pending Order, the Journal
All of this context — news, seasonality, the cycle, the bot signal — doesn't replace the actual trading platform. After the analysis, the trader goes back to their own chart, finds the exact entry per their strategy, sets a pending order, and simply waits for price to trigger it. No rushing, no early deviation from the plan.
Once the trade is open, it gets logged straight into the trade journal: asset, direction, strategy, timeframe, position size, trade behavior and a setup description.
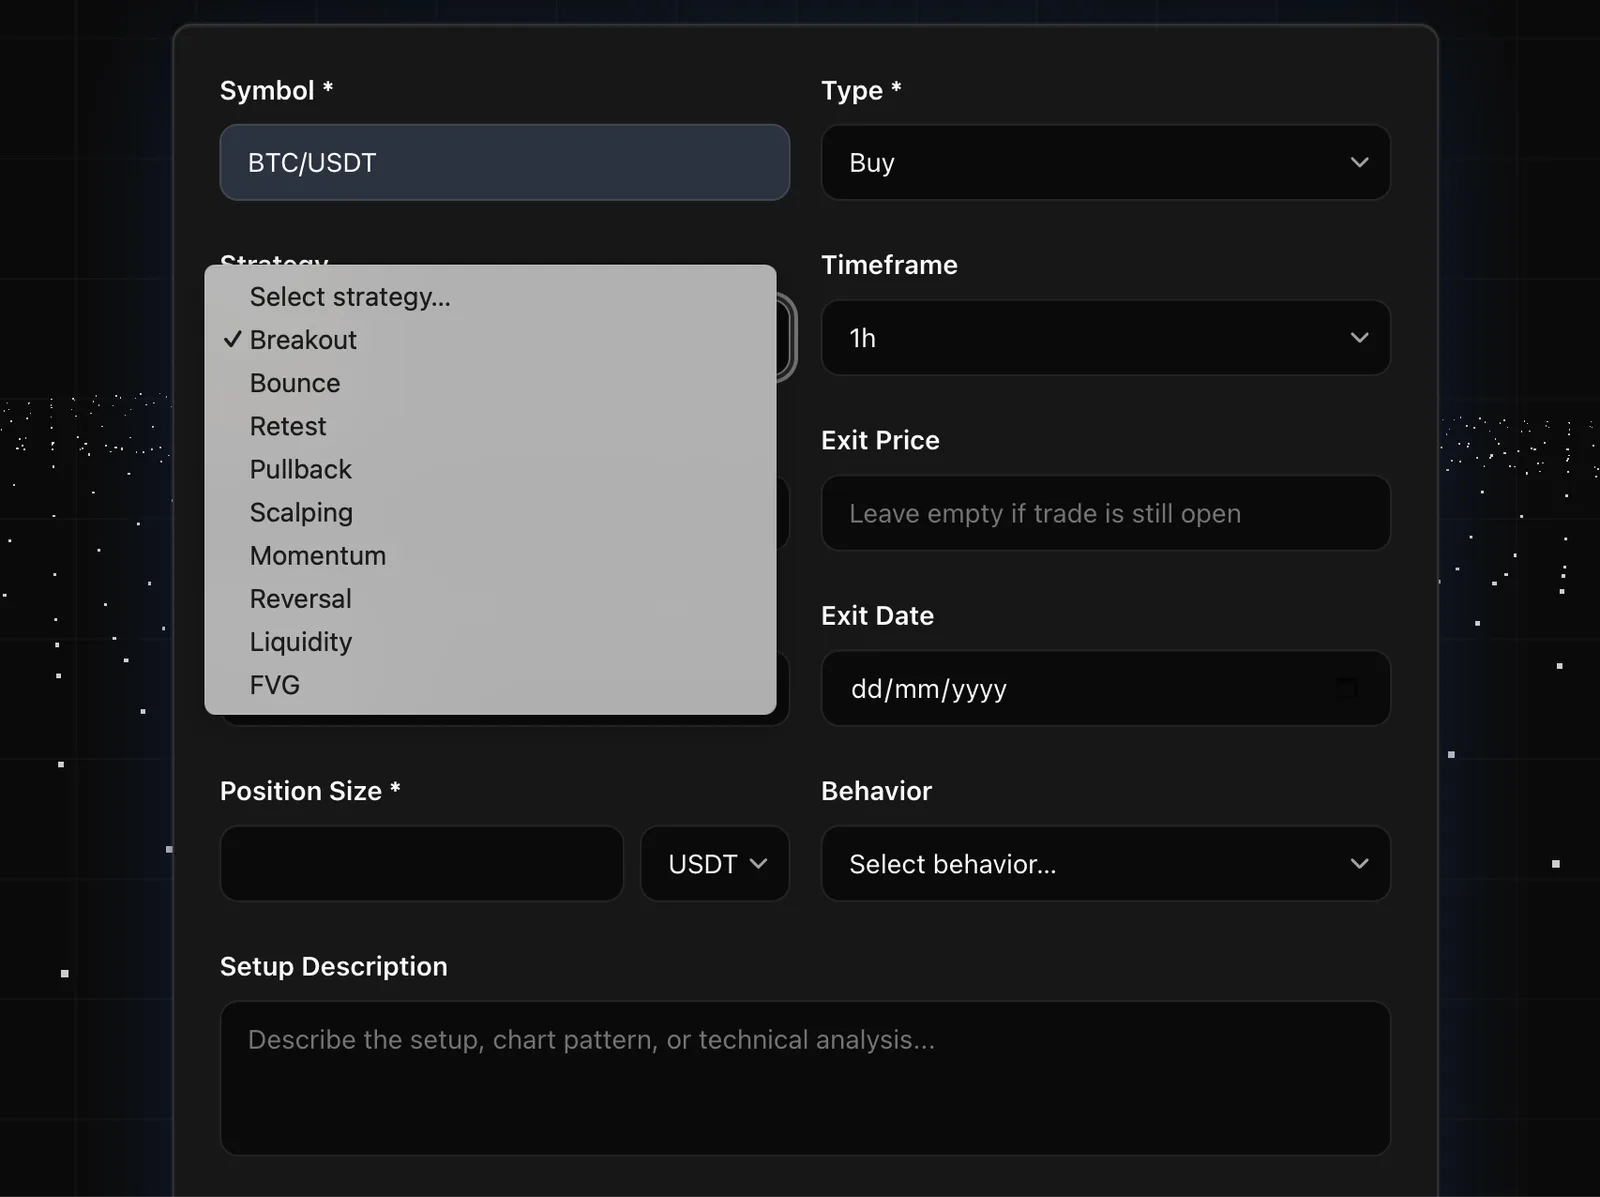
When the trade closes, the final result gets added — profit or loss, the actual exit price, and the date. This is where most traders stop and just move on. NeuroTrader doesn't.
Step 5. AI Review — How Well Was the Trade Actually Executed
Once enough trade history builds up, AI doesn't just review a single trade — it analyzes the whole trading style: how many trades total, how many have notes, which instrument gets traded most, and most importantly, what type of trader is behind the data.
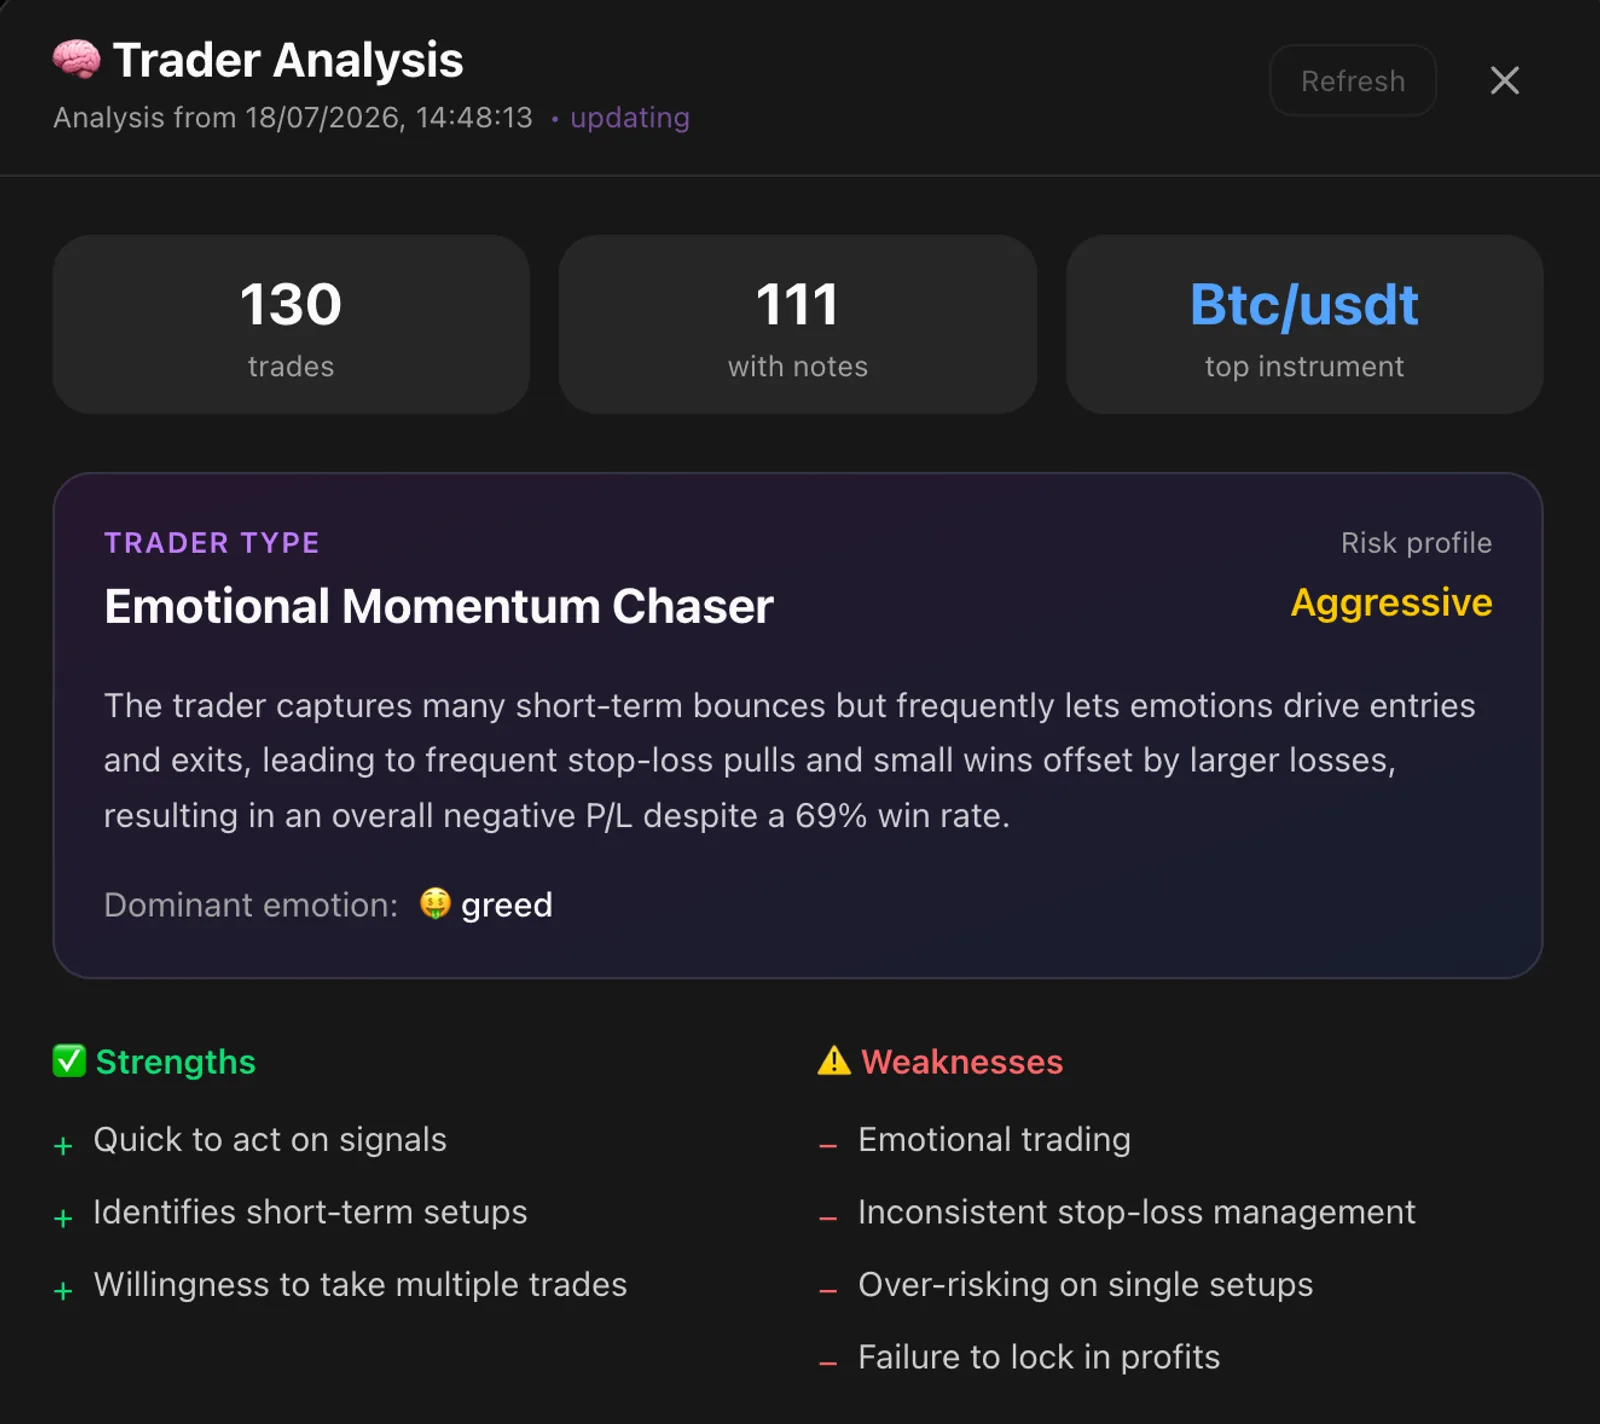
In the screenshot, a real example: 130 trades, 111 with notes, top instrument BTC/USDT. The trader type is flagged as an "Emotional Momentum Chaser" with an aggressive risk profile: the trader catches plenty of short-term bounces, but emotions frequently drive entries and exits, stop-losses get pulled inconsistently, and the overall P/L is negative despite a 69% win rate. Below that are concrete strengths (quick to act on signals, good at spotting short-term setups) and weaknesses (emotional trading, inconsistent stop-loss management, over-risking on single setups, failing to lock in profits in time).
This is the real value of the journal — not a plus/minus list, but a mirror that honestly shows what's going on in the trader's head from trade to trade, and exactly what needs fixing so a high win rate finally turns into a positive result.
Build Your Own Routine
Start the day with News, check context in Market Seasonality and Bitcoin Cycle, confirm the signal on Trading Bot V2 — and log every trade in the journal.
Good trading isn't one brilliant trade — it's a routine repeated every day: context, signal, discipline, review. NeuroTrader builds that routine around you, one step at a time.